


The monitoring service requests your WordPress URL on a schedule instead of waiting for a person to notice a problem.
WordPress Uptime Monitoring Plugin
WordPress Uptime Monitoring Plugin
WordPress Uptime Monitoring With Early Downtime Alerts
Know when your WordPress site goes down before customers or clients report it. WPMissionControl checks availability, tracks response time, records uptime history, and routes early alerts through email, SMS, or Slack with practical evidence for the investigation.
Because “it loaded for me” is not a monitoring system. A 200 OK response is useful. Context is better.
Scheduled checks
Manual checks
Response-time history
Status and headers
Manual checks
Response-time history
Status and headers
Current status
Online
Avg. response
1.16s
Last 30 days
What is WordPress uptime monitoring?
WordPress uptime monitoring automatically checks a website at regular intervals to confirm that it is reachable and returning a valid response. When a check detects downtime or an availability problem, an uptime monitoring service can send an early alert so the site owner can investigate before visitors report it. WPMissionControl also records response time, uptime history, status codes, headers, SSL context, and recovery details.
24/7Automatic checks keep watching when your team is offline.
200 OKResponse headers and status codes help confirm what the server returned.
1.16sAverage response time makes slowdowns visible before they become complaints.
30 daysThe uptime graph gives your team a quick recent availability view.
The essentials
How WordPress uptime monitoring works.
An uptime monitor checks your website from outside WordPress, records the result, and alerts your team when the site does not respond as expected. This gives you an independent signal even when you cannot open the WordPress admin area.
Status, response code, response time, headers, and check history create a useful availability record.
When the site fails a check, the right people can be notified early and later confirm when the site responds again.
WordPress-aware monitoring
Your WordPress site can be online and still fail users.
A homepage response is not the whole story. Your site may still be slow, return unexpected headers, have SSL issues, show open WordPress health issues, or need page-level checks for important URLs.
OnlineThe main URL responds, but that does not prove every important page works.
SlowThe server responds, but the delay may already feel like failure to visitors.
Partially checkedPage availability monitoring matters when a team needs more than the main domain.
Technically unclearSSL status, headers, and open issues help explain what to review after an uptime alert.
Scheduled checks
Scheduled uptime checks keep watch for you.
WPMissionControl checks whether your WordPress site responds when it should and records the important details for follow-up.
- Automatic scheduled uptime checks for active WordPress sites.
- Manual uptime checks when you need to know right now.
- Response status, response code, response time, and last check result.
- Check history that makes incidents easier to understand later.
Because “I checked it yesterday” is not a monitoring strategy.
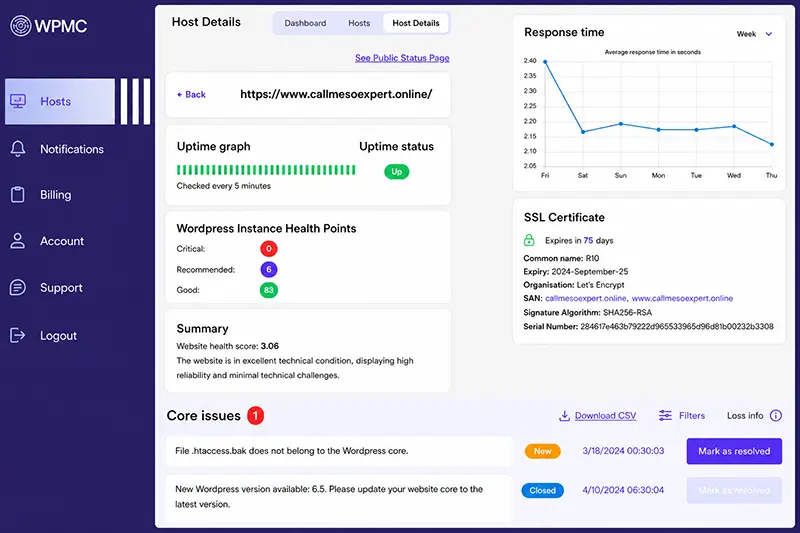
Dashboard
One clean view for uptime, response time, and technical evidence.
The uptime area in WPMissionControl is not a fictional control room. It is a practical WordPress monitoring view: current status, recent checks, average response time, uptime graph, response-time chart, request headers, and response headers.
Sample from the WPMissionControl admin dashboard
Uptime status
Up
Last scheduled run 4 mins ago
Manual check just now
Next run in 17 secs
Manual check just now
Next run in 17 secs
Average response time
1.16 s
Past 30 days (daily avg)
Uptime graph
Last 30 days – days with downtime incidents are marked in red
Uptime (31 days)
99.98%
Response time
7 days v
Request headers
Optional: add HTTP headers such as Authorization or X-Custom-Header. These can be sent with connectivity checks when your setup requires them.
Response headers
Status Code: 200
Content-Type: text/html; charset=UTF-8
Date: Thu, 28 May 2026 16:01:23 GMT
Link: <https://example.com/wp-json/>; rel=”https://api.w.org/”
Server: nginx
Set-Cookie: wpmc_user_id=b1c4ccaa-6be5-4745-8e51; expires=Sat, 27 May 2028 16:01:23 GMT
X-Ray: app/monitor/802008
Content-Type: text/html; charset=UTF-8
Date: Thu, 28 May 2026 16:01:23 GMT
Link: <https://example.com/wp-json/>; rel=”https://api.w.org/”
Server: nginx
Set-Cookie: wpmc_user_id=b1c4ccaa-6be5-4745-8e51; expires=Sat, 27 May 2028 16:01:23 GMT
X-Ray: app/monitor/802008
Response time
A slow response is an early warning, even before a full outage.
If your site technically responds but takes too long, visitors can experience it as broken. The response-time chart and average response time help you see whether the site is only available on paper or actually usable.
Average response time
Review the daily average response time instead of relying on one manual page load.
Response-time graph
Watch response changes across the selected period and spot patterns that deserve attention.
Evidence for support
Use status and response details when you contact hosting or explain an issue to a client.
Availability explained
What does a WordPress uptime percentage mean?
Uptime percentage is the share of monitored time during which your WordPress site was available. Small percentage differences can represent meaningful downtime, especially for stores, lead-generation websites, membership sites, and client websites.
| Uptime | Approximate downtime per 30 days | What it can mean |
|---|---|---|
| 99% | About 7 hours 12 minutes | Long enough for many visitors, leads, or orders to be affected. |
| 99.9% | About 43 minutes | A short monthly outage window that still deserves investigation. |
| 99.95% | About 22 minutes | Better availability, but incidents can still interrupt important journeys. |
| 99.99% | About 4 minutes | Strong availability that still requires monitoring and a response plan. |
Uptime percentage = successful monitored time / total monitored time x 100
Downtime context
Downtime events should become a timeline, not a mystery.
Most uptime tools tell you when your site is down. WPMissionControl helps you understand the bigger picture around the event: when it started, how long it lasted, what recovered, and which related signals deserve attention.
First failed check
See the first moment monitoring confirmed that the site stopped responding correctly.
Recovery point
Record when the site came back online instead of guessing the outage window later.
Duration and history
Compare recent downtime with previous incidents and recurring response-time patterns.
Website Black Box
Your website needs a black box, not just an alarm.
When something goes wrong, WPMissionControl keeps the evidence close: recent successful checks, failed responses, recovery signals, response time, response headers, SSL status, and related site health context. Downtime is not just an event. It is evidence.
Last known good signalStart with the uptime status and the most recent scheduled or manual check.
Response time before troubleUse the response-time chart and average response time to see whether the site was slowing down.
Status codes and headersLook at response headers and server details instead of guessing what happened.
Recovery and next checksReview the follow-up signals, SSL context, open issues, notifications, and status communication.
Example incident
A small outage becomes a useful record.
Instead of a vague memory that “the site was weird earlier,” your team can walk through the signals in order and decide what to do next.
Response time starts rising
Important page checks become unstable
First failed check
Server returns intermittent 500 errors
Site recovers
WPMissionControl preserves the clues: response time, failed checks, status codes, headers, and recent WordPress issues
Result: the site may be back online, but the cause still matters. In the WPMissionControl dashboard, you can review the timeline, response-time changes, failed checks, status codes, headers, and recent WordPress issues in one place, so you can understand what may have caused the downtime even after the site is working again.
Use cases
When uptime monitoring saves you from guessing.
The real value is not only knowing that a site had trouble. It is knowing enough to respond calmly, explain clearly, and bring useful details to the next conversation.
After a plugin update
The site still opens, but response time jumps and an important page may need attention. A green “online” badge does not always mean the site is healthy.
Before a client notices
You see the incident before the “Is the site down?” message arrives. The worst uptime alert is the one that comes from a customer.
When hosting support asks for details
You can bring status codes, response time, headers, and timing instead of saying “it was slow earlier.” Support conversations get easier when evidence is ready.
When the site is online but practically broken
The homepage may respond while checkout, forms, login, or key landing pages still need attention. WordPress can fail quietly. WPMissionControl keeps notes.
WordPress context
Is uptime monitoring enough for WordPress?
Not always. Basic uptime monitoring confirms that a URL responds. WordPress sites often need more context: response time, SSL status, headers, page-level checks, open issues, and recent technical changes.
Response timeA slow site can feel broken before it fully goes down.
SSL statusAvailability and trust belong in the same review.
HeadersStatus codes and response headers make the server answer easier to inspect.
Page-level checksImportant pages may need their own attention when Agency-level coverage is enabled.
Context you can actually check
What else should you review after an uptime issue?
Uptime is more useful when the same product keeps the surrounding WordPress monitoring signals close. These are practical areas already represented in WPMissionControl pages and dashboard samples, not imaginary panels.
SSL certificate statusA site can be reachable while HTTPS trust still needs attention.
Average response timeSlow response can be the first sign that availability is becoming fragile.
Request headersCustom request headers help with connectivity checks for setups that require them.
Response headersStatus code, server, content type, and related response data give support teams better evidence.
WordPress health pointsOpen issues next to uptime make it easier to decide what deserves follow-up.
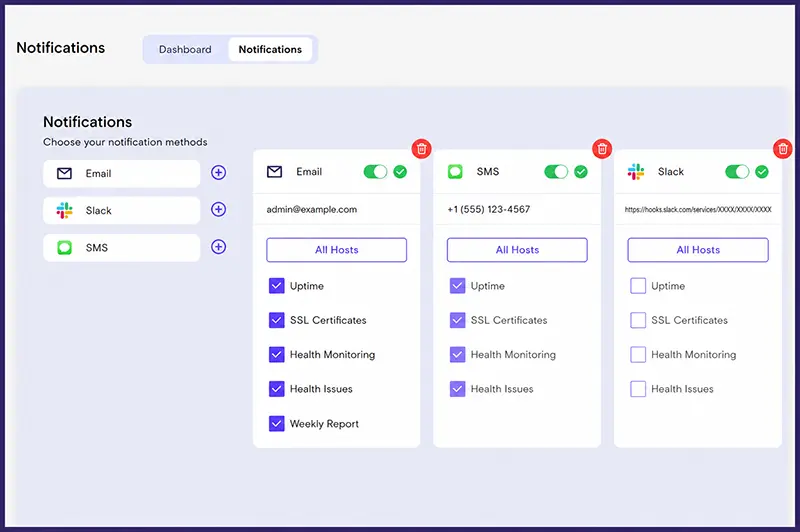
Notification channelsEmail, SMS, and Slack options help route alerts to the people who can act.
Public status pageStatus communication helps teams avoid vague “is it down?” conversations.
Page availabilityAgency-level page monitoring can help teams watch pages beyond the main domain.

Uptime plus SSL
Uptime and SSL belong together.
A site can be online and still create trust problems when HTTPS needs attention. That is why uptime checks and SSL monitoring work well as neighboring signals in a WordPress monitoring workflow.
- Review uptime status without losing sight of certificate health.
- Use SSL monitoring to catch expiration and configuration risks earlier.
- Keep availability and trust signals visible for business-critical sites.
Early warning workflow
How early WordPress downtime alerts reduce response time.
An alert is useful only when it reaches someone who can act and includes enough context to begin investigating. WPMissionControl keeps the alert connected to the monitoring evidence and recovery timeline.
Scheduled check runsYour WordPress site is checked automatically while your team works, sleeps, or supports other clients.
Failure is detectedThe monitor records the failed response, response code, timing, and related details.
The right channel alertsEmail, SMS, or Slack can route the warning to the person responsible for the site.
Your team investigatesUse uptime history, response time, headers, SSL status, and open issues as starting evidence.
Recovery is recordedConfirm when the site responds again and keep the event timeline for follow-up.
Alerts
Know before your client, customer, or boss asks.
The worst uptime alert is the one that comes from a customer. WPMissionControl helps you catch problems earlier and gives you better evidence for the support conversation that follows.
Basic uptime checker
Acts like a siren. It says something happened, but the next investigation is mostly manual.
WPMissionControl
Acts more like an operating view. It keeps uptime status, response time, headers, SSL context, and notification settings close.
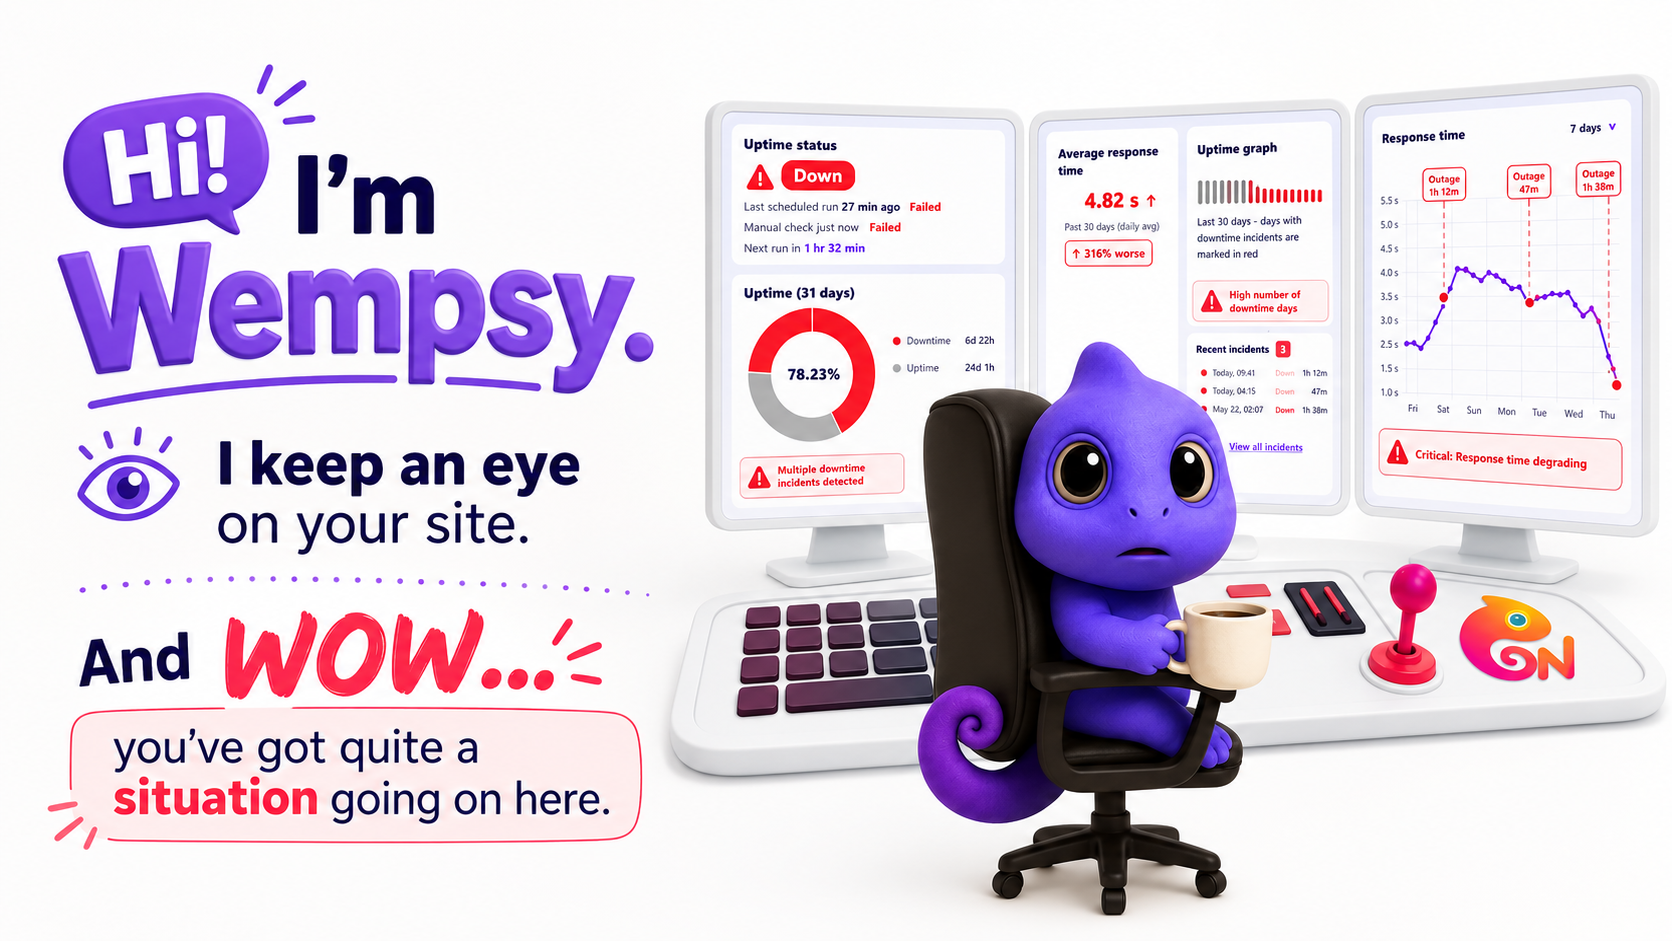
Wempsy is on watch
Your site has someone watching from the inside
From inside the WPMissionControl dashboard, Wempsy keeps an eye on your WordPress uptime signals: response time, failed checks, status codes, headers, and recent incidents. When something goes wrong, you get more than an alert — you get clues that help explain what happened, even after the site is working again.
“The site blinked. I saw it.”
“Server responded. Eventually. We should talk.”
“Good news: it came back. Better news: I kept the evidence.”
“200 OK is nice. But I still checked the headers.”
Who it helps
Built for WordPress site owners and agencies.
WordPress is not a static page. It is themes, plugins, database work, caching, hosting, SSL, cron, forms, WooCommerce, SEO, and updates. Monitoring needs to respect that context.
FreelancersKeep client websites visible without dashboard hopping.
AgenciesWatch multiple signals and respond with clearer evidence.
WooCommerce storesSpot availability or speed trouble before checkout suffers.
Business ownersKnow whether the site is reachable when leads depend on it.
SEO teamsReview downtime near crawling, performance, and visibility changes.
Support teamsSend hosting support a timeline instead of a vague complaint.
After an alert
What you can do after an uptime alert.
Better evidence means faster support conversations. Instead of saying “the site was down sometime today,” you can review the event record and the related WordPress health signals.
1
Check response historyReview response code, response time, and the last successful check.
2
Review downtime durationConfirm the first failed check, repeated failures, and recovery time.
3
Inspect technical evidenceCheck request headers, response headers, status code, and server response details.
4
Review nearby site healthLook at SSL status, open issues, and page availability when those checks are enabled.
5
Contact hosting with evidenceSend timestamps, status code, headers, and response-time details to speed up support.
Difference
How this differs from a basic uptime checker.
A simple uptime checker asks, “Does the site open?” WPMissionControl keeps the uptime answer close to response time, headers, SSL context, notifications, and status communication.
| Basic uptime checker | WPMissionControl uptime monitoring |
|---|---|
| Focuses mainly on whether a URL responds. | Tracks availability, response time, recent check history, uptime graph, request headers, response headers, and related site-health areas. |
| Alerts you that something went wrong. | Helps you review what the monitoring data showed before you contact hosting or update a client. |
| Usually treats downtime as an isolated event. | Keeps uptime beside SSL status, open issues, notification channels, response time, and status page communication. |
| Leaves support conversations vague. | Gives your team a clearer timeline to share with hosting, clients, or stakeholders. |
Setup
Start monitoring in four simple steps.
No elaborate server work is needed for the landing-page story: connect the site, activate monitoring, set alerts, and use the WPMissionControl dashboard to review uptime, response time, headers, and status history.
1
Install
Add WPMissionControl to your WordPress site.

2
Connect
Add your website URL and review the host list from the dashboard.

3
Activate
Enable uptime and issue monitoring for the site that needs protection.

4
Track
Review uptime status, response time, incidents, and public status data.

FAQ
Questions before you start?
Short answers for WordPress teams comparing uptime monitoring tools, plugins, and website health dashboards.
What is WordPress uptime monitoring?+
WordPress uptime monitoring is the process of regularly checking whether a WordPress website is online, reachable, and returning a valid response. WPMissionControl records availability checks, response time, downtime events, and recovery status.
Why is uptime monitoring important for WordPress?+
WordPress sites depend on hosting, themes, plugins, databases, SSL, forms, caching, cron jobs, and updates. Uptime monitoring helps you catch availability problems before visitors, customers, or clients report them.
Is uptime monitoring enough to know if my site is healthy?+
No. Uptime is one important signal, but it does not prove the whole site is healthy. A useful WordPress monitoring setup also reviews response time, SSL status, open issues, headers, and notification coverage.
Can a site be online but still broken?+
Yes. The main URL can return 200 OK while response time, headers, SSL status, or important page checks still deserve attention. That is why WordPress-aware monitoring should look beyond a single ping.
Does WPMissionControl track response time?+
Yes. WPMissionControl tracks response time so you can see whether a site is merely available or actually responding fast enough for visitors and customers.
Can I manually check my site?+
Yes. Manual checks are useful before a client call, after a plugin update, after a deployment, or whenever the site feels suspiciously quiet.
How does uptime monitoring help agencies?+
Agencies can monitor client sites, detect downtime earlier, review uptime and response history, use notification channels, and communicate with clients or hosting providers using clearer evidence.
How is this different from a basic uptime checker?+
A basic uptime checker usually tells you whether a URL is up or down. WPMissionControl keeps uptime beside response time, uptime graph data, request headers, response headers, SSL status, issue context, notifications, and public status communication.
How do WordPress downtime alerts work?+
A monitoring service checks your WordPress website on a schedule. When a check detects that the site is unavailable or returning an unexpected response, it records the event and sends an alert through a configured channel such as email, SMS, or Slack so your team can investigate early.
What is a good uptime percentage for a WordPress site?+
A higher uptime percentage means less measured downtime. For perspective, 99.9% uptime is about 43 minutes of downtime in a 30-day month, while 99.99% is about 4 minutes. The right target depends on how much an interruption costs your business and users.
Will uptime monitoring slow down WordPress?+
Uptime monitoring uses lightweight external requests to check whether your site responds. It does not require a person to repeatedly load the website, and the monitoring result remains available even when the WordPress admin area cannot be reached.
Stop treating downtime like a lonely alarm.
Let WPMissionControl watch your WordPress site and keep uptime, response time, headers, SSL context, notifications, and status communication in one practical monitoring workflow.
Know What’s Happening — Without Guessing.
WPMissionControl watches over your WordPress site day and night, tracking uptime, security, performance, and visual integrity.
AI detects and explains changes, warns about risks, and helps you stay one step ahead.
Your site stays safe, transparent, and under your control — 24/7.
No credit card · 30 sec setup · Includes free status page
Related Articles
Website Monitoring vs WordPress Maintenance: What’s the Difference?
Monitoring vs maintenance Website Monitoring vs WordPress Maintenance: What’s the Difference? Website monitoring and WordPress maintenance work together, but they are not the same thing. Monitoring tells you what is happening. Maintenance is the work you do to keep the site healthy. Many WordPress site owners invest in updates, backups, security scans, and performance improvements, […]
How SSL Monitoring Helps Protect WordPress Checkout and Login Pages
Secure WordPress availability How SSL Monitoring Helps Protect WordPress Checkout and Login Pages Checkout and login pages are some of the most valuable pages on a WordPress site. If SSL fails there, users may not complete purchases, access accounts, submit forms, or trust the website enough to continue. Many teams monitor uptime at the homepage […]
The WordPress SSL Monitoring Checklist for Agencies and Site Managers
SSL monitoring checklist The WordPress SSL Monitoring Checklist for Agencies and Site Managers Managing one WordPress SSL certificate is easy to forget. Managing dozens across client sites, landing pages, subdomains, staging environments, and ecommerce stores is where problems start. A checklist helps, but automated monitoring is what keeps the checklist alive. Agencies and site managers […]
SSL Expiration and WordPress Downtime: What Site Owners Need to Know
WordPress SSL monitoring SSL Expiration and WordPress Downtime: What Site Owners Need to Know An expired SSL certificate can make a WordPress site look unsafe even when the server is still online. For visitors, that browser warning often feels the same as downtime: they cannot confidently reach your content, checkout, forms, or login area. WordPress […]
Why SSL Certificate Monitoring Matters for WordPress Uptime
WordPress SSL certificate monitoring Why SSL Certificate Monitoring Matters for WordPress Uptime A WordPress site can be technically online and still feel unavailable to visitors if the SSL certificate expires, breaks, or is misconfigured. Browser warnings, blocked checkout pages, failed forms, and lost trust can turn a small certificate issue into a serious uptime problem. […]
How Often Should You Check WordPress Uptime? A Practical Guide for Site Owners
WordPress uptime monitoring How Often Should You Check WordPress Uptime? A WordPress site can go offline for many reasons: a failed plugin update, a hosting issue, an expired SSL certificate, a heavy traffic spike, or a slow server that eventually stops responding. The real question is not whether downtime can happen. It is how quickly […]
What Is Website Uptime Monitoring (And Why It Matters for WordPress)
WordPress Uptime Monitoring Plugin What Is Website Uptime Monitoring (And Why It Matters for WordPress) Website uptime monitoring is the practice of checking whether a website is online, reachable, and responding the way it should. For WordPress site owners, that sounds simple on paper, but it solves a very real problem: many outages are not […]
How to Monitor WordPress Uptime (Step-by-Step Guide)
WordPress Uptime Monitoring Plugin How to Monitor WordPress Uptime (Step-by-Step Guide) Monitoring WordPress uptime is not just about knowing whether your site is online at this exact moment. It is about building a reliable process: one that checks the site continuously, alerts you when something changes, records incident history, and helps you spot warning signs […]
Why Your WordPress Site Goes Down (And How to Detect It Fast)
WordPress Uptime Monitoring Plugin Why Your WordPress Site Goes Down (And How to Detect It Fast) A WordPress website rarely goes down for no reason. Sometimes the cause is obvious — a failed update, a hosting issue, a bad deployment, or an expired certificate. Other times the site becomes unstable slowly through poor performance, resource […]